Visualize This: The FlowingData Guide to Design, Visualization, and Statistics
Goodreads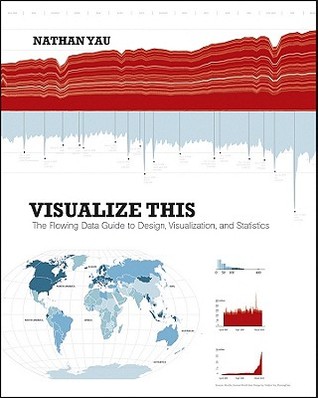
Nathan Yau
résumé
Data doesn't decrease; it is ever-increasing and can be overwhelming to organize in a way that makes sense to its intended audience. Wouldn't it be wonderful if we could actually visualize data in such a way that we could maximize its potential and tell a story in a clear, concise manner? Thanks to the creative genius of Nathan Yau, we can. With this full-color book, data visualization guru and author Nathan Yau uses step-by-step tutorials to show you how to visualize and tell stories with data. He explains how to gather, parse, and format data and then design high quality graphics that help you explore and present patterns, outliers, and relationships.
Presents a unique approach to visualizing and telling stories with data, from a data visualization expert and the creator of flowingdata.com, Nathan Yau Offers step-by-step tutorials and practical design tips for creating statistical graphics, geographical maps, and information design to find meaning in the numbers Details tools that can be used to visualize data-native graphics for the Web, such as ActionScript, Flash libraries, PHP, and JavaScript and tools to design graphics for print, such as R and Illustrator Contains numerous examples and descriptions of patterns and outliers and explains how to show them Visualize This demonstrates how to explain data visually so that you can present your information in a way that is easy to understand and appealing.