工具教程


数据结构
Douban
殷人昆
/
陶永雷
…
1999
- 7
数据结构是计算机专业的核心课程,是从事计算机软件开发、应用人员应当必备的专业基础。随着计算机的日益普及,简单的数据结构知识已经下放到中学的计算机课程中,并已成为计算机软件考试的必考课程之一。本书是根据作者在北京清华大学及美国密西根州GrandValley州立大学多年教学的经验,并参考了近年出版的多种国外大学数据结构和面向对象软件工程教科书编写的。内容包括:数组、链接表、栈和队列、递归、树与森林、图、堆与优先级队列、集合与搜索结构、排序、索引结构与散列等。书中采用面向对象的观点讨论数据结构技术,并以兼有面向过程和面向对象双重特色的C++语言作为算法的描述工具,强化基本知识和基本能力的双基训练。全书条理清晰,通俗易懂,图文并茂,适于自学。
本书适合作大专院校中计算机或软件专业的教材,也可供计算机软件人员和计算机用户阅读。
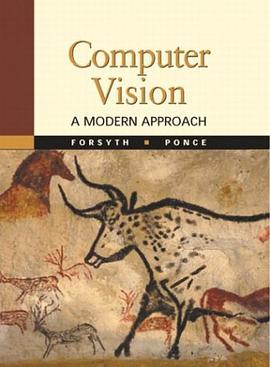
Computer Vision
Douban
David A. Forsyth
/
Jean Ponce
publishing house:
Prentice Hall
2002
- 8
Appropriate for upper-division undergraduate- and graduate-level courses in computer vision found in departments of Computer Science, Computer Engineering and Electrical Engineering. This long anticipated book is the most complete treatment of modern computer vision methods by two of the leading authorities in the field. This accessible presentation gives both a general view of the entire computer vision enterprise and also offers sufficient detail for students to be able to build useful applications. Students will learn techniques that have proven to be useful by first-hand experience and a wide range of mathematical methods.
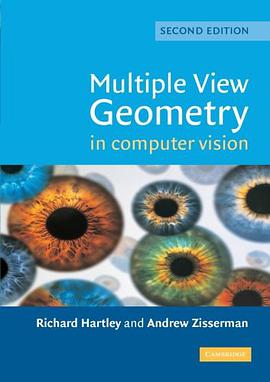
Multiple View Geometry in Computer Vision
DoubanA basic problem in computer vision is to understand the structure of a real world scene given several images of it. Techniques for solving this problem are taken from projective geometry and photogrammetry. Here, the authors cover the geometric principles and their algebraic representation in terms of camera projection matrices, the fundamental matrix and the trifocal tensor. The theory and methods of computation of these entities are discussed with real examples, as is their use in the reconstruction of scenes from multiple images. The new edition features an extended introduction covering the key ideas in the book (which itself has been updated with additional examples and appendices) and significant new results which have appeared since the first edition. Comprehensive background material is provided, so readers familiar with linear algebra and basic numerical methods can understand the projective geometry and estimation algorithms presented, and implement the algorithms directly from the book.
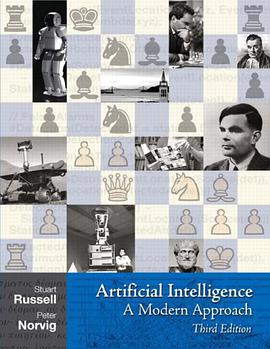
Artificial Intelligence
Douban Goodreads
Stuart Russell
/
Peter Norvig
publishing house:
Pearson
2009
The long-anticipated revision of this #1 selling book offers the most comprehensive, state of the art introduction to the theory and practice of artificial intelligence for modern applications. Intelligent Agents. Solving Problems by Searching. Informed Search Methods. Game Playing. Agents that Reason Logically. First-order Logic. Building a Knowledge Base. Inference in First-Order Logic. Logical Reasoning Systems. Practical Planning. Planning and Acting. Uncertainty. Probabilistic Reasoning Systems. Making Simple Decisions. Making Complex Decisions. Learning from Observations. Learning with Neural Networks. Reinforcement Learning. Knowledge in Learning. Agents that Communicate. Practical Communication in English. Perception. Robotics. For computer professionals, linguists, and cognitive scientists interested in artificial intelligence.
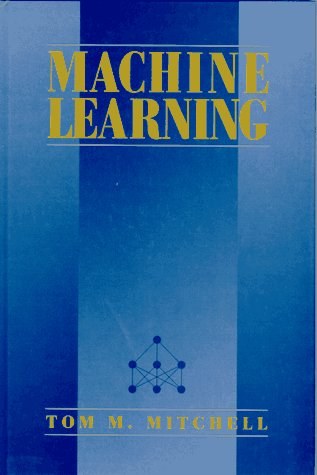
Machine Learning
DoubanThis book covers the field of machine learning, which is the study of algorithms that allow computer programs to automatically improve through experience. The book is intended to support upper level undergraduate and introductory level graduate courses in machine learning.
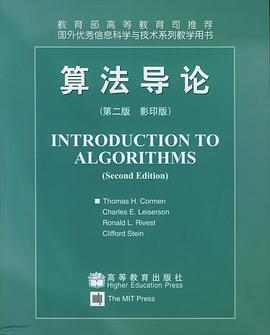
算法导论
Douban
[美] Thomas H. Cormen
/
Charles E. Leiserson
…
publishing house:
高等教育出版社
2002
- 5
《算法导论》自第一版出版以来,已经成为世界范围内广泛使用的大学教材和专业人员的标准参考手册。
这本书全面论述了算法的内容,从一定深度上涵盖了算法的诸多方面,同时其讲授和分析方法又兼顾了各个层次读者的接受能力。各章内容自成体系,可作为独立单元学习。所有算法都用英文和伪码描述,使具备初步编程经验的人也可读懂。全书讲解通俗易懂,且不失深度和数学上的严谨性。第二版增加了新的章节,如算法作用、概率分析与随机算法、线性编程等,几乎对第一版的各个部分都作了大量修订。
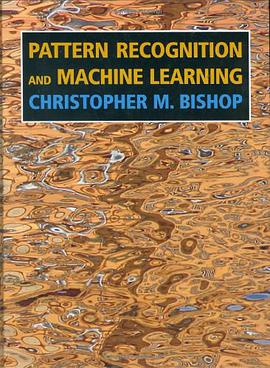
Pattern Recognition and Machine Learning
Pattern Recognition and Machine Learning (Information Science and Statistics) Douban GoodreadsThe dramatic growth in practical applications for machine learning over the last ten years has been accompanied by many important developments in the underlying algorithms and techniques. For example, Bayesian methods have grown from a specialist niche to become mainstream, while graphical models have emerged as a general framework for describing and applying probabilistic techniques. The practical applicability of Bayesian methods has been greatly enhanced by the development of a range of approximate inference algorithms such as variational Bayes and expectation propagation, while new models based on kernels have had a significant impact on both algorithms and applications.
This completely new textbook reflects these recent developments while providing a comprehensive introduction to the fields of pattern recognition and machine learning. It is aimed at advanced undergraduates or first-year PhD students, as well as researchers and practitioners. No previous knowledge of pattern recognition or machine learning concepts is assumed. Familiarity with multivariate calculus and basic linear algebra is required, and some experience in the use of probabilities would be helpful though not essential as the book includes a self-contained introduction to basic probability theory.
The book is suitable for courses on machine learning, statistics, computer science, signal processing, computer vision, data mining, and bioinformatics. Extensive support is provided for course instructors, including more than 400 exercises, graded according to difficulty. Example solutions for a subset of the exercises are available from the book web site, while solutions for the remainder can be obtained by instructors from the publisher. The book is supported by a great deal of additional material, and the reader is encouraged to visit the book web site for the latest information.
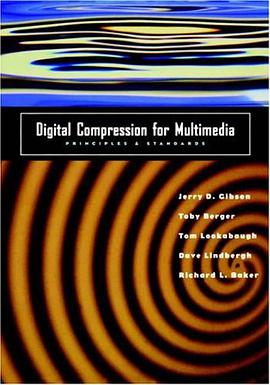
Digital Compression for Multimedia
Douban
Jerry D. Gibson
/
Toby Berger
…
publishing house:
Morgan Kaufmann
1998
- 1

写给大家看的设计书(第3版)
The Non-Designer's Design Book Douban Goodreads
[美] Robin Williams
translator:
苏金国
/
刘亮
publishing house:
人民邮电出版社
2009
- 1
这本书出自一位世界级设计师之手。复杂的设计原理在书中凝炼为亲密性、对齐、重复和对比4 个基本原则。作者以其简洁明快的风格,将优秀设计所必须遵循的这4 个基本原则及其背后的原理通俗易懂地展现在读者面前。本书包含大量的示例,让你了解怎样才能按照自己的方式设计出美观且内容丰富的产品。
此书适用于各行各业需要从事设计工作的读者,也适用于有经验的设计人员。

slide:ology
Douban
[美国] 南希·杜瓦特
publishing house:
O'Reilly Media
2008
- 8
Praise for slide:ology
Copyright
Dedication
Acknowledgments
Foreword
Introduction
Chapter 1. Creating a New Slide Ideology
建立全新的幻灯理念
Section 1.1. Don't Commit Career Suislide
不要委托职业的幻灯制作者
Section 1.2. A Case for Presentations
一个演示案例
Section 1.3. So Where Do You Begin?
从哪里开始?
Section 1.4. Case Study: Mark Templeton
案例研究:
Section 1.5. The Presentation Ecosystem
演示系统
Section 1.6. World Class Presentations Require Time and Focus
世界级的演示要求时间和焦点
Section 1.7. Responding to Audience Needs
响应听众需求
Section 1.8. How Do You Define Your Audience?
如何定义你的听众
Section 1.9. Case Study: Rick Justice Creating Great Presence
案例研究:
Section 1.10. Case Study: ZS Associates An Incentive to Communicate Clearly
案例研究:ZS
Chapter 2. Creating Ideas, Not Slides
建立理念,而不是幻灯
Section 2.1. Finding Your Inspiration
找到灵感
Section 2.2. Innovating with Sticky Notes
使用即时贴创新
Section 2.3. Case Study: Bill McDonough
案例研究:
Section 2.4. Sketching Your Way to Success
画出成功之路
Section 2.5. Collaborating to Get Clarity
??清晰
Section 2.6. Case Study: Mitchell Baker
案例研究:
Section 2.7. Sketching Ideas Using Diagrams
使用图解描绘概念
Section 2.8. Sketching Complete Ideas
描绘完整的概念
Chapter 3. Creating Diagrams
创建图解
Section 3.1. Classifying Diagrams
图解分类
Section 3.2. Abstract Concepts: Flow
抽象概念:流程
Section 3.3. Abstract Concepts: Structure
抽象概念:结构
Section 3.4. Abstract Concepts: Cluster
抽象概念:聚集
Section 3.5. Abstract Concepts: Radiate
抽象概念:发散
Section 3.6. Realistic Concepts: Pictorial
形象概念:插画
Section 3.7. Realistic Concepts: Display Data
形象概念:显示数据--与图表相关的内容
Section 3.8. Making Diagrams Work Together
综合运用图解
Section 3.9. Strengthening the Diagram's Concept
强化图解概念
Chapter 4. Displaying Data
显示数据--本章讲统计图表
Section 4.1. Following the Five Data Slide Rules
五条数据幻灯原则
Section 4.2. Telling the Truth
说出事实
Section 4.3. Getting to the Point
说出重点
Section 4.4. Picking the Right Tool for the Job
使用正确的工具
Section 4.5. Highlighting What's Important
强调重要的
Section 4.6. Chart Makeovers
图表美化
Section 4.7. Case Study: Healthy Waters
案例研究:
Chapter 5. Thinking Like a Designer
象设计师一样思考
Section 5.1. The Value of Design
设计的价值
Section 5.2. Revealing Yourself Through Design Decisions
??设计决策
Section 5.3. Case Study: Al Gore
案例研究:Al Gore(美国前副总统)
Section 5.4. Designing Effective Slides
设计有效的幻灯
Chapter 6. Arranging Elements
安排元素
Section 6.1. Placement of Elements Creates Meaning
元素的位置有意义
Section 6.2. Contrast: Identifying the Main Point Quickly
对比:快速识别主要点
Section 6.3. Flow: Ordering How the Information Is Processed
流程:排序信息处理流程
Section 6.4. Hierarchy: Seeing Relationships Between Elements
层次:发现元素之间的联系
Section 6.5. Unity: Sensing the Structure of Information
联合:了解信息结构
Section 6.6. Case Study: Adobe Controlling
案例研究:
Section 6.7. Proximity: Perceiving Meaning from Location
就近:感知位置意义
Section 6.8. Whitespace: Getting Visual Breathing Room
留白:留下视觉上的喘息空间
Section 6.9. Case Study: Garr Reynolds
案例研究:Garr Reynolds(演示之禅的作者)
Section 6.10. Finding Beauty in the Design Around You
发现身边的设计之美
Chapter 7. Using Visual Elements: Background, Color, and Text
使用视觉元素:背景,颜色,文本
Section 7.1. The Ingredients of a Great Slide
卓越幻灯的要素
Section 7.2. Background
背景
Section 7.3. Backgrounds Are a Surface for Digital Assets
背景是数字资产的外表
Section 7.4. Traversing Flatland and Dimensions
??平面和维度
Section 7.5. Creating a Sense of Space
建立空间感
Section 7.6. Determining the Light Source
决定光源
Section 7.7. Color
颜色
Section 7.8. About the Color Wheel
色彩轮
Section 7.9. Using the Power of Color
使用颜色的力量
Section 7.10. Choosing Your Colors
选择你自己的颜色
Section 7.11. Using Industry Color Palettes
使用行业颜色板
Section 7.12. Assembling a Color Palette
配置颜色板
Section 7.13. Case Study: BzzAgent
案例研究:
Section 7.14. Text
文本
Section 7.15. Dissecting a Font
解剖字体
Section 7.16. How Many Words Should Be on a Slide?
一张幻灯上多少字
Section 7.17. Typesetting
排版
Section 7.18. Typesetting a Block of Text
排版大量文字
Section 7.19. Obeying Gun Laws and Bullet Laws
遵从??原则
Section 7.20. Validating Your Font Size
验证字体大小
Section 7.21. Playing Text Animations as the Audience Enters
使用文字动画
Chapter 8. Using Visual Elements: Images
使用视觉元素:图片
Section 8.1. Assembling an Image System
配置图片系统
Section 8.2. Photography
摄影
Section 8.3. Case Study: School District
案例研究:
Section 8.4. Taking Your Own Photos
使用自己的照片
Section 8.5. Illustrations
插图
Section 8.6. Creating an Illustration Library
建立插画库
Section 8.7. Illustrating Complex Stories
图解复杂的故事
Section 8.8. Stylizing Diagrams and Illustrations
风格化图示和图解
Section 8.9. Case Study: Dr. Mike Magee
案例研究:
Section 8.10. Case Study: Incorporating Video
案例研究:
Chapter 9. Creating Movement
建立运动
Section 9.1. Designing Time-Based Scenes
设计基于时间的场景
Section 9.2. Planning Animations
计划动画
Section 9.3. Animating Serves a Purpose
动画服务于目标
Section 9.4. Taking Lessons from the Movies
从电影学习
Section 9.5. Making Objects Move and Change
让对象运动和改变
Section 9.6. Creating Panoramas and Scenes
建立全景图
Section 9.7. Creating Scenes, Not Slides
建立场景,而不是幻灯
Section 9.8. Case Study: Guerrino De Luca
案例研究:
Section 9.9. Brainstorming Meaningful Metaphors
头脑风暴有意义的隐喻
Section 9.10. Case Study: Rare
案例研究:
Section 9.11. Avoiding Visual Vertigo
避免视觉眩晕
Chapter 10. Governing with Templates
用模板管理
Section 10.1. Arming Your Workforce
武装你的工作人员
Section 10.2. Making Template Design Decisions
制定模板设计原则
Section 10.3. Case Study: Hewlett-Packard
案例研究:HP
Section 10.4. Experimenting with Various Looks
尝试不同的外观
Section 10.5. Following Template Guidelines
遵守模板指南
Section 10.6. Building Presentations Collaboratively
协同建立演示
Chapter 11. Interacting with Slides
与幻灯交互
Section 11.1. The Power of Constraints
约束的力量
Section 11.2. Constraining the Text
约束文字
Section 11.3. Reducing Text on a Slide
减少文字
Section 11.4. Navigating Through Your Message
导航你的信息
Section 11.5. Constraining the Length
控制长度
Section 11.6. Case Study: Pecha Kucha
案例研究:
Section 11.7. Constraining the Projector
控制投影仪
Section 11.8. All the World's a Stage
世界的舞台
Section 11.9. How Many Slides? Use the 10/20/30 Rule.
多数张幻灯?10/20/30原则
Section 11.10. How Many Slides? The Sky Is the Limit.
多数张幻灯?天高任鸟飞
Section 11.11. How Many Slides? Depends on the Technology.
多数张幻灯?看使用的技术
Section 11.12. To Project or Not to Project
投影还是不投影
Section 11.13. Case Study: John Ortberg
案例研究:
Section 11.14. Small Device, Big Impact
小设备,大印象
Section 11.15. Case Study: Jill Bolte-Taylor
案例研究:
Section 11.16. A Call to Relate
??
Chapter 12. Manifesto: The Five Theses of the Power of a Presentation
纲领:5个观点
Section 12.1. Treat Your Audience as King
以听众为中心
Section 12.2. Spread Ideas and Move People
传播理念、感动人们
Section 12.3. Help Them See What You're Saying
让他们看到你所说的
Section 12.4. Practice Design, Not Decoration
学习设计,而不是装饰
Section 12.5. Cultivate Healthy Relationships
加强有益的联系
References
Index
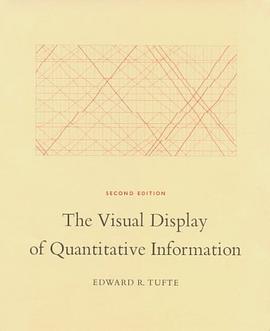
The Visual Display of Quantitative Information
The Visual Display of Quantitative Information Douban Goodreads
Edward R. Tufte
publishing house:
Graphics Pr
2001
- 1
The classic book on statistical graphics, charts, tables. Theory and practice in the design of data graphics, 250 illustrations of the best (and a few of the worst) statistical graphics, with detailed analysis of how to display data for precise, effective, quick analysis. Design of the high-resolution displays, small multiples. Editing and improving graphics. The data-ink ratio. Time-series, relational graphics, data maps, multivariate designs. Detection of graphical deception: design variation vs. data variation. Sources of deception. Aesthetics and data graphical displays.
This is the second edition of The Visual Display of Quantitative Information. Recently published, this new edition provides excellent color reproductions of the many graphics of William Playfair, adds color to other images, and includes all the changes and corrections accumulated during 17 printings of the first edition.
This book celebrates escapes from the flatlands of both paper and computer screen, showing superb displays of high-dimensional complex data. The most design-oriented of Edward Tufte's books, Envisioning Information shows maps, charts, scientific presentations, diagrams, computer interfaces, statistical graphics and tables, stereo photographs, guidebooks, courtroom exhibits, timetables, use of color, a pop-up, and many other wonderful displays of information. The book provides practical advice about how to explain complex material by visual means, with extraordinary examples to illustrate the fundamental principles of information displays. Topics include escaping flatland, color and information, micro/macro designs, layering and separation, small multiples, and narratives. Winner of 17 awards for design and content. 400 illustrations with exquisite 6- to 12-color printing throughout. Highest quality design and production.
Visual Explanations: Images and Quantities, Evidence and Narrative is about pictures of verbs, the representation of mechanism and motion, process and dynamics, causes and effects, explanation and narrative. Practical applications and examples include statistical graphics, charts for making important decisions in engineering and medicine, technical manuals, diagrams, design of computer interfaces and websites and on-line manuals, animations and scientific visualizations, techniques for talks, and design strategies for enhancing the rate of information transfer in print, presentations, and computer screens. The use of visual evidence in deciding to launch the space shuttle Challenger is discussed in careful detail. Video snapshots show redesigns of a supercomputer animation of a thunderstorm. The book is designed and printed to the highest standards, with luscious color throughout and four built-in flaps for showing motion and before/after effects.