数据可视化
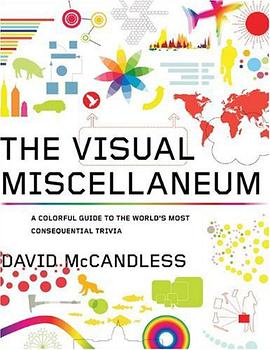
The Visual Miscellaneum
Douban
David McCandless publishing house: Harper Design 2009 - 11
The Visual Miscellaneum is a unique, groundbreaking look at the modern information age, helping readers make sense of the countless statistics and random facts that constantly bombard us. Using cutting edge graphs, charts, and illustrations, David McCandless creatively visualizes the world's surprising relationships and compelling data, covering everything from the most pleasurable guilty pleasures to how long it takes different condiments to spoil to world maps of Internet search terms.
科学前沿图谱:知识可视化的探索(第二版)
[美]陈超美 Douban
陈超美著;陈悦等 translator: 陈悦 / 王贤文 … publishing house: 科学出版社有限责任公司 2015 - 3
本书从跨学科的视角探索了知识可视化的历史进程及其最新进展。从无形学院和库恩竞争范式,到运用可视化技术绘制知识结构图谱,再到科学发展进程中的各种兴盛与衰落。通过大量色彩丰富的图片,深入浅出地将绘制科学知识图谱的原理、方法及技术娓娓道来。 本书既涉及到简单易学的可视化步骤和模型,也有应用于实际的具体案例分析,是一本对于研究者和实践者都很有价值的参考书,可供科学政策分析机构、投资机构、咨询公司管理人员、技术人员和高校相关专业师生阅读参考。
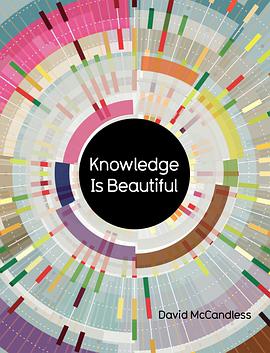
Knowledge Is Beautiful
Douban Skybridge
McCandless, David publishing house: Harper Design 2014 - 10 other title: Knowledge Is Beautiful: Impossible Ideas, Invisible Patterns, Hidden Connections--Visualized
In this sequel to the bestselling book The Visual Miscellaneum, author David McCandless uses stunning and unique visuals to reveal unexpected insights into how the world really works. Every day, every hour, every minute we are bombarded with information, from television, from newspapers, from the Internet, we’re steeped in it. We need a way to relate to it. Enter David McCandless and his stunning infographics, simple, elegant ways to interact with information too complex or abstract to grasp any way but visually. McCandless creates visually stunning displays that blend the facts with their connections, contexts, and relationships, making information meaningful, entertaining, and beautiful. And his genius is as much in finding fresh ways to provocatively combine datasets as it is in finding new ways to show the results. Knowledge is Beautiful is a fascinating spin through the world of visualized data, all of it bearing the hallmark of David McCandless’s boundary-breaking, signature style. The captivating follow-up to the bestseller The Visual Miscellaneum, Knowledge is Beautiful offers a deeper, more ranging look at the world and its history, with more connectivity between the pages, a greater exploration of causes and consequences, and a more inclusive global outlook. With a portion of its content crowd-sourced from McCandless’s international following, Knowledge is Beautiful achieves a revolutionary and democratic look at the key issues from questions on history and politics, the facts of science, streams of literature, and much more. This is a project that will truly push the boundaries of books everywhere, providing insights into our world in a way never seen before.
The Wall Street Journal Guide to Information Graphics
Douban Goodreads
Dona M. Wong publishing house: W. W. Norton & Company 2010 - 1
Here, the news graphics director at "The Wall Street Journal" gives a step-by-step guide to executing clear and concise graphics for everyone from the average PowerPoint user to the sophisticated professional, showing how to use different techniques to convey messages eloquently and effectively.
数据可视化实战
Interactive data visualization for the Web Douban
[美] Scott Murray translator: 李松峰 publishing house: 人民邮电出版社 2013 - 6
你手头有一些数据,想做成漂亮的图表放到网站上?好主意,通过浏览器来跨平台实现数据可视化是正确的选择。什么,你还想让图表能够响应用户操作?没问题,交互式图表比静态图片更能吸引人去探究本源。好啦,要生成通过浏览器展示的动态图表,首选目前最热门的Web数据可视化库——D3。 这本书很有意思,而且对读者要求不高。不需要知道什么是数据可视化,也不用有太多Web开发背景就能看懂它。不信?翻一翻就知道这是一本既好玩又实用的动手指南啦!看完这本书你会怎么样呢? 掌握必要的HTML、CSS、JavaScript和SVG基础知识; 学会基于数据在网页里生成元素和为它们设置样式的技巧; 能够生成条形图、散点图、饼图、堆叠条形图和力导向图; 使用平滑的过渡动画来展示数据的变化; 赋予图表动态交互能力,响应用户从不同角度探索数据的请求; 收集数据和创建自定义的地图; 另外,本书100多个代码示例都可以在线浏览!