
读过《W. E. B. Du Bois's Data Portraits: Visualizing Black America》 🌕🌕🌕🌕🌕
1900年的作品,和现代的大数据可视化别无二致——不单单是设计,还有配色,与地图的搭配等等。Du Bois 比我想的还要多才多艺。当时能够想到这般利用和呈现社会统计数据,这才华让人惊叹。
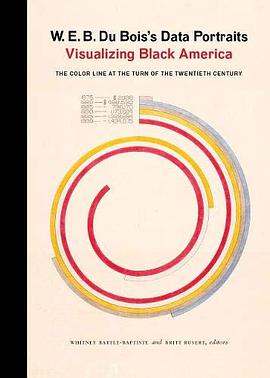
Book
W. E. B. Du Bois's Data Portraits: Visualizing Black America
Douban GoodreadsThe colorful charts, graphs, and maps presented at the 1900 Paris Exposition by famed sociologist and black rights activist W. E. B. Du Bois offered a view into the lives of black Americans, conveying a literal and figurative representation of "the color line." From advances in education to the lingering effects of slavery, these prophetic infographics-beautiful in design and powerful in content- make visible a wide spectrum of black experience. W. E. B. Du Bois's Data Portraits collects the complete set of graphics in full color for the first time, making their insights and innovations available to a contemporary imagination. As Maria Popova wrote, these data portraits shaped how "Du Bois himself thought about sociology, informing the ideas with which he set the world ablaze three years later in The Souls of Black Folk."