Drop #705 (2025-09-05): If It Walks Like A 🦆…
Processing NGINX Logs With DuckDB; Observable Notebooks 2.0 💙 🦆; Textplot
It is time, once again, to obsess over my fav database, which we’ll do with three very different resource sections.
Type your email…
Subscribe
TL;DR
(This is an LLM/GPT-generated summary of today’s Drop using SmolLM3-3B-8bit via MLX and a custom prompt.)
- Processing NGINX Logs With DuckDB (https://duckdb.org/docs/stable/guides/file_formats/read_file)
This section describes parsing gzip’d nginx logs using DuckDB, leveraging regex to extract client IP, timestamp, full request, and other fields. It notes that ~1.3 million log lines were processed in ~2.4 seconds, with a focus on identifying bot traffic via user agent analysis. - Observable Notebooks 2.0 💙 🦆 (https://observablehq.com/notebook-kit/databases)
This sectionhighlights the improved database support in Observable Notebooks 2.0, including interactive SQL querying, local caching, and support for PostgreSQL, BigQuery, and more. It references an updated blog post demonstrating DuckDB integration. - Textplot (https://query.farm/duckdb_extension_textplot.html)
This section introduces the Textplot DuckDB Extension, enabling real-time ASCII/Unicode visualizations within SQL queries. It emphasizes the extension’s utility for quick data exploration and lightweight dashboards without external charting libraries.
Processing NGINX Logs With DuckDB
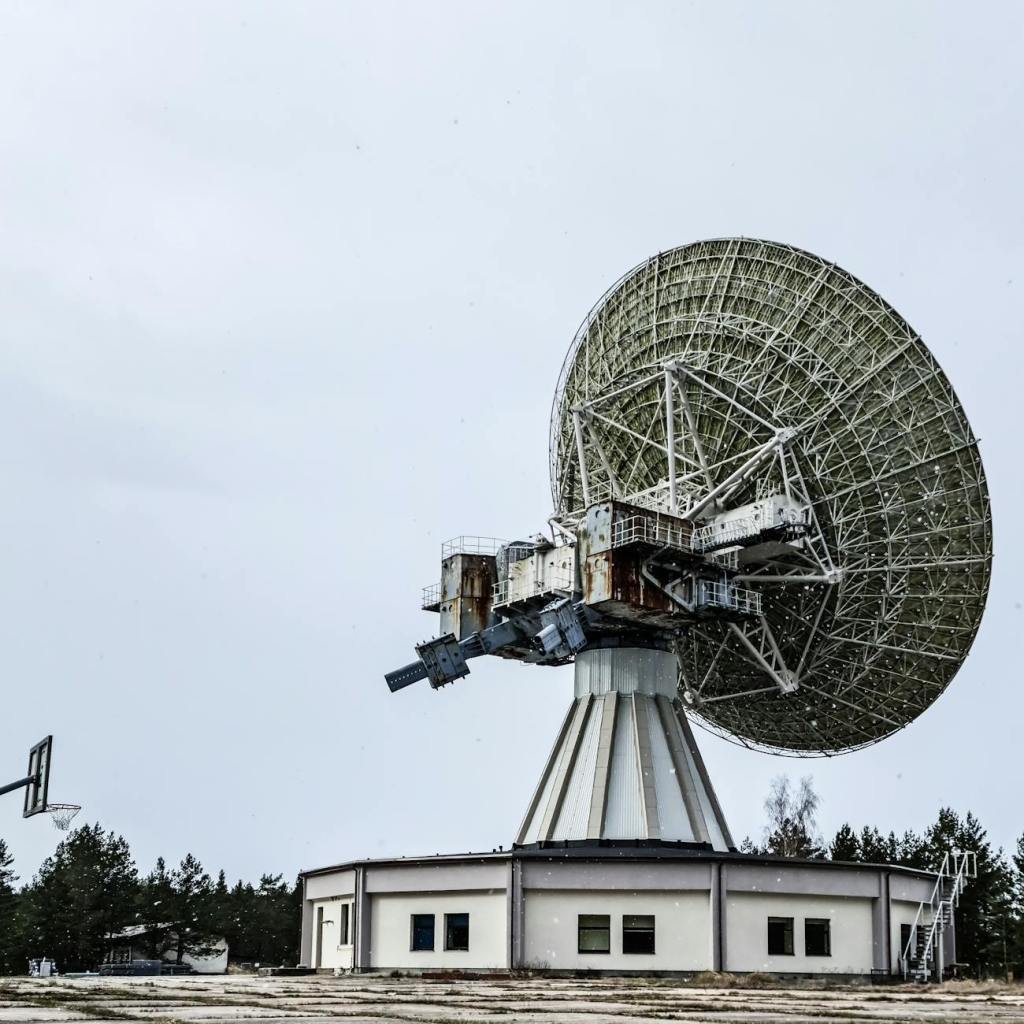
Photo by Townsend Walton on
Pexels.comI’m in the long and slow process of moving off of WordPress, first for my legacy blog and also for this newsletter. The old blog runs on an ancient VPS that desperately needs a migration, and the blog itself has not been reacting well (thanks to the puny amount of resources on the VPS) to the influx of our “AI” overlords.
I haven’t poked super hard (until today) at the bot traffic (this is the only site I still have detailed logging on), and I keep threatening some infosec pals that I’d show how to process semi-structured logs with DuckDB, and this seemed like a perfect opportunity to get two red items off the ledger (yes, I did recently watch “The First Avenger”).
I have ~50-ish gzip’d nginx logs that we’re going to read in, parse, and have ready to start looking at bot encounters.
While DuckDB can just read text files, it’s far easier to reconfigure the CSV reader to just return a single column that we can post-process:
FROM read_csv('logs/rud.is.access.log*', auto_detect=FALSE, header=FALSE, columns={'line':'VARCHAR'}, delim='\t', strict_mode=FALSE)LIMIT 5;┌──────────────────────────────────────────────────────────────────────────────┐│ line ││ varchar │├──────────────────────────────────────────────────────────────────────────────┤│ 98.82.110.41 - - [05/Sep/2025:02:10:33 -0400] "GET /cisa-kev.rss HTTP/1.1"… ││ 47.128.31.167 - - [05/Sep/2025:02:10:56 -0400] "GET /rswitch/guide/index.h… ││ 47.128.31.167 - - [05/Sep/2025:02:10:56 -0400] "GET /rswitch/guide/site_li… ││ 47.128.31.167 - - [05/Sep/2025:02:10:56 -0400] "GET /rswitch/guide/site_li… ││ 47.128.31.167 - - [05/Sep/2025:02:10:56 -0400] "GET /rswitch/guide/site_li… │└──────────────────────────────────────────────────────────────────────────────┘With log lines in hand, let’s use some regex magic to break up the nginx fields and see what we have to work with:
CREATE OR REPLACE TABLE logs AS (FROM read_csv( 'logs/rud.is.access.log*', auto_detect=FALSE, header=FALSE, columns={'line':'VARCHAR'}, delim='\t', strict_mode=FALSE)SELECT -- Basic fields regexp_extract(line, '^([0-9\.]+)', 1) AS client_ip, regexp_extract(line, '\[(.*?)\]', 1) AS timestamp, -- Full request string (everything between first set of quotes) regexp_extract(line, '"([^"]+)"', 1) AS full_request, -- Parse components from full request regexp_extract(line, '"([A-Z]+)\s', 1) AS http_method, regexp_extract(line, '"[A-Z]+\s([^\s]+)\s', 1) AS request_path, regexp_extract(line, 'HTTP/([0-9\.]+)"', 1) AS http_version, -- Response details regexp_extract(line, '"\s([0-9]{3})\s', 1)::INT AS status_code, regexp_extract(line, '"\s[0-9]{3}\s([0-9]+)', 1)::BIGINT AS response_size_bytes, -- Referrer and User Agent regexp_extract(line, '[0-9]+\s"([^"]*)"', 1) AS referrer, regexp_extract(line, '"([^"]+)"$', 1) AS user_agent, -- Parse timestamp components (optional) regexp_extract(timestamp, '([0-9]+/[A-Za-z]+/[0-9]+)', 1) AS date, regexp_extract(timestamp, ':([0-9]{2}:[0-9]{2}:[0-9]{2})', 1) AS time, regexp_extract(timestamp, '([-+][0-9]+)$', 1) AS timezone, -- Categorize status codes CASE WHEN regexp_extract(line, '"\s([0-9]{3})\s', 1)::INT < 300 THEN 'Success' WHEN regexp_extract(line, '"\s([0-9]{3})\s', 1)::INT < 400 THEN 'Redirect' WHEN regexp_extract(line, '"\s([0-9]{3})\s', 1)::INT < 500 THEN 'Client Error' ELSE 'Server Error' END AS status_category);FROM logs SELECT COUNT(*) AS nrows;┌────────────────┐│ nrows ││ int64 │├────────────────┤│ 1289059 ││ (1.29 million) │└────────────────┘FROM ( FROM logs SELECT strptime(date, '%d/%b/%Y')::DATE AS date)SELECT MIN(date) AS start_date, MAX(date) AS end_date;┌────────────┬────────────┐│ start_date │ end_date ││ date │ date │├────────────┼────────────┤│ 2025-07-15 │ 2025-09-05 │└────────────┴────────────┘So, ~1.3 million log lines spanning mid-July to this morning.
The hyperfine benchmarking tool says it took ~2.4s to process them all on my, now ancient, M1 MacBook Pro.
Let’s see how the parsing went:
duckdb --json -c "FROM logs LIMIT 1" nginx.ddb | jq
[ { "client_ip": "98.83.163.27", "timestamp": "04/Sep/2025:02:10:12 -0400", "full_request": "GET /cisa-kev.rss HTTP/1.1", "http_method": "GET", "request_path": "/cisa-kev.rss", "http_version": "1.1", "status_code": 200, "response_size_bytes": 100463, "referrer": "-", "user_agent": "Zapier", "date": "04/Sep/2025", "time": "02:10:12", "timezone": "-0400", "status_category": "Success" }]We can definitely work with that!
Halfway decent bots/crawlers/spiders/etc. generally let you know who they are in the User-Agent field, and most use some format like Mozilla/5.0 (compatible; MJ12bot/v1.4.8; http://mj12bot.com/) as a signature. Let’s see how many we have to work with:
FROM logsSELECT COUNT(DISTINCT user_agent) AS countWHERE regexp_matches(lower(user_agent), 'bot|crawl|spider|slurp|crawler|fetch|robot|archive|index|search|bot|spider|crawl|slurp|fetch|robot|archive|index|search'); ┌───────┐│ count ││ int64 │├───────┤│ 2690 │└───────┘
Ugh. That’s alot of unique signatures.
Thankfully, our “AI” overlords have trained their proprietary and open weights models on lots of internet data. Said data included a decent percentage of these strings, many of which are paired with colloquial/short names for the service.
I used Ollama and llama3.2b in a Bash/curl script that I made, and had Claude pretty up to assign short names to the ugly signature strings:
#!/bin/bash# ConfigurationUSER_AGENTS_FILE="user_agents.txt"OLLAMA_URL="http://localhost:11434/api/generate"MODEL="llama3.2:latest"MAX_LINES=$(wc -l < "${USER_AGENTS_FILE}" | xargs)OUTPUT_FILE="bot_names_results.txt"# ANSI color codesRED='\033[0;31m'GREEN='\033[0;32m'BLUE='\033[0;34m'YELLOW='\033[1;33m'NC='\033[0m' # No Color# Check if user_agents.txt existsif [ ! -f "$USER_AGENTS_FILE" ]; then echo -e "${RED}Error: $USER_AGENTS_FILE not found!${NC}" exit 1fi# Function to call Ollama APIgenerate_bot_name() { local user_agent="$1" # Craft an improved prompt with examples and context local prompt="You are a bot naming expert. Generate a SHORT, memorable name (1-3 words) for this web crawler/bot based on its user agent string.Rules:- Keep it simple and descriptive- Use the actual bot/product name if clearly visible- Make it memorable and easy to pronounce- Avoid generic terms like 'Web Crawler' or 'Bot'- Focus on the brand/service name when availableExamples of good names:- For Googlebot user agent → 'Google Bot'- For AhrefsBot user agent → 'Ahrefs Spider'- For Slackbot user agent → 'Slack Bot'- For meta-externalagent → 'Meta Agent'- For MJ12bot → 'MJ12 Bot'- For ClaudeBot → 'Claude Bot'- For PetalBot → 'Petal Bot'User Agent: $user_agentGenerate ONLY the bot name (nothing else):" # Create JSON payload local json_payload=$(jq -n \ --arg model "$MODEL" \ --arg prompt "$prompt" \ '{model: $model, prompt: $prompt, stream: false, temperature: 0.3}') # Call Ollama API with timeout local response=$(timeout 10 curl -s -X POST "$OLLAMA_URL" \ -H "Content-Type: application/json" \ -d "$json_payload") # Check if curl timed out if [ $? -eq 124 ]; then echo "Request Timeout" return fi # Extract the response text and clean it local bot_name=$(echo "$response" | jq -r '.response' 2>/dev/null | \ tr -d '\n' | \ sed 's/^[[:space:]]*//;s/[[:space:]]*$//' | \ sed 's/^"//;s/"$//' | \ head -n 1) # If response is empty or too long, return error if [ -z "$bot_name" ] || [ ${#bot_name} -gt 50 ]; then echo "Generation Failed" else echo "$bot_name" fi}# Main scriptecho -e "${BLUE}═══════════════════════════════════════════════════════════${NC}"echo -e "${GREEN}Bot Name Generator - Processing first $MAX_LINES user agents${NC}"echo -e "${BLUE}═══════════════════════════════════════════════════════════${NC}"echo# Initialize output file with header{ echo "Bot Name Generation Results" echo "Generated on: $(date)" echo "Model: $MODEL" echo "=========================================" echo} > "$OUTPUT_FILE"# Counter for limiting to first 20count=0successful=0failed=0# Store results for summarydeclare -a resultsdeclare -a bot_names_only# Read file line by linewhile IFS= read -r line && [ $count -lt $MAX_LINES ]; do # Skip empty lines if [ -z "$line" ]; then continue fi # Increment counter ((count++)) echo -e "${YELLOW}[$count/$MAX_LINES]${NC} Processing..." # Clean and truncate user agent for display clean_line=$(echo "$line" | tr -d '"') if [ ${#clean_line} -gt 70 ]; then display_line="${clean_line:0:67}..." else display_line="$clean_line" fi echo -e " User Agent: ${BLUE}$display_line${NC}" # Generate bot name bot_name=$(generate_bot_name "$line") # Check if generation was successful if [[ "$bot_name" == "Generation Failed" ]] || [[ "$bot_name" == "Request Timeout" ]]; then echo -e " Generated: ${RED}$bot_name${NC}" ((failed++)) results+=("FAILED|$display_line") else echo -e " Generated: ${GREEN}$bot_name${NC}" ((successful++)) results+=("$bot_name|$display_line") bot_names_only+=("$bot_name") # Save to file { echo "Entry #$count" echo "User Agent: $line" echo "Generated Name: $bot_name" echo "-----------------------------------------" echo } >> "$OUTPUT_FILE" fi echo # Small delay to avoid overwhelming the API sleep 0.3done < "$USER_AGENTS_FILE"# Print summaryecho -e "${BLUE}═══════════════════════════════════════════════════════════${NC}"echo -e "${GREEN}Summary Report${NC}"echo -e "${BLUE}═══════════════════════════════════════════════════════════${NC}"echo -e "Total Processed: ${YELLOW}$count${NC}"echo -e "Successful: ${GREEN}$successful${NC}"echo -e "Failed: ${RED}$failed${NC}"if [ $count -gt 0 ]; then echo -e "Success Rate: ${GREEN}$(( successful * 100 / count ))%${NC}"fiechoecho -e "${BLUE}Results saved to: ${YELLOW}$OUTPUT_FILE${NC}"echo# Display all results in a table formatecho -e "${BLUE}═══════════════════════════════════════════════════════════${NC}"echo -e "${GREEN}Generated Names Summary${NC}"echo -e "${BLUE}═══════════════════════════════════════════════════════════${NC}"echoi=1for result in "${results[@]}"; do IFS='|' read -r name agent <<< "$result" if [[ "$name" == "FAILED" ]]; then printf "%2d. ${RED}%-25s${NC} <- %s\n" "$i" "[Failed]" "${agent:0:50}" else printf "%2d. ${GREEN}%-25s${NC} <- %s\n" "$i" "$name" "${agent:0:50}" fi ((i++))doneechoecho -e "${BLUE}═══════════════════════════════════════════════════════════${NC}"# Save just the bot names to a separate file for easy useif [ ${#bot_names_only[@]} -gt 0 ]; then echo echo -e "${YELLOW}Saving bot names list to: bot_names_only.txt${NC}" printf "%s\n" "${bot_names_only[@]}" > bot_names_only.txtfiechoecho -e "${GREEN}Script complete!${NC}"echo -e "${BLUE}═══════════════════════════════════════════════════════════${NC}"(These things sure do like color and emojis.)
I did some manual post-processing to combine some names together, then used those mappings to see what the top 20 bots hitting the site have been since mid-July:
FROM logs l, ua_map uSELECT u.bot_name AS bot_name, COUNT(*) AS countWHERE l.user_agent = u.user_agentGROUP BY 1ORDER BY 2 DESCLIMIT 30;┌────────────┬───────┐│ bot_name │ count ││ varchar │ int64 │├────────────┼───────┤│ MJ12 │ 37710 ││ OpenAI │ 33956 ││ Petal │ 30720 ││ ThinkBot │ 27538 ││ Slack │ 22008 ││ Anthropic │ 20682 ││ Bing │ 16086 ││ ByteDance │ 15752 ││ Mau │ 14506 ││ Semrush │ 14405 ││ Barkrowler │ 14174 ││ Amazon │ 13979 ││ Ahrefs │ 11966 ││ Google │ 11215 ││ Apple │ 9602 ││ BLEX │ 9214 ││ StartMe │ 7477 ││ Serpstat │ 6007 ││ Ready │ 5704 ││ Seekport │ 5645 ││ Meta Agent │ 5379 ││ InoReader │ 5334 ││ Dot │ 5242 ││ Scour RSS │ 4821 ││ SuperFeedr │ 4320 ││ Mastodon │ 3697 ││ Feedly │ 2563 ││ Inoreader │ 2083 ││ DataForSeo │ 2068 ││ Yandex │ 2059 │├────────────┴───────┤│ 30 rows 2 columns │└────────────────────┘
From that list, the ones I know for sure are AI-related or have malicious intent are:
- OpenAI: 33,956 (~1K/day)
- ThinkBot: 27,538 (~800/day)
- Anthropic: 20,682 (~600/day)
While those are not giant numbers, when they do their 600-1,000 iterations a day, they do not do so in a nice manner and put just enough load to have the WordPress install stutter for 1-5 seconds (which I notice because I do monitor everything).
I block ThinkBot at the nginx-level and am considering doing to for a few more of the user-agents, since I’m kind of “done” with commercial, generative “AI” companies.
I put both the user-agent short-namer script and the user-agent mapping table into the gists for these Drops, and hope the not-too-deep look at using DuckDB to work with logs was helpful to a few folks.
Observable Notebooks 2.0 💙 🦆 (& More DBs)
Database support was a bit sketch in the inaugural release of Observable Notebooks 2.0, but the team sure made up for that in the most recent update.
Their database connectors support a wide array of sources, and bridge the gap between your notebooks (which run in browsers) and databases (which typically don’t expose HTTP APIs). They let you write SQL directly in notebook cells and see results instantly, without manually exporting data files.
Like their predecessor ObservableHQ notebooks, you can query databases interactively with dynamic parameters from UI elements like sliders or dropdowns. This dramatically speeds up exploratory data analysis since you don’t need to predict what data you’ll need upfront.
Unlike Observable 1.0 noebooks, query results are automatically saved locally in .observable/cache. This means faster loading, consistent data across visitors, and the ability to share notebooks without database access. Everything runs locally on your machine – your data and credentials never go through Observable’s servers, and are never exposed through the notebook “apps”.
Supported databases include:
- DuckDB (great for analytics, works out of the box)
- SQLite (lightweight, file-based)
- PostgreSQL (and compatible databases like ClickHouse, Redshift)
- Snowflake (cloud data warehouse)
- Google BigQuery (Google’s analytics database)
- Databricks (unified analytics platform)
Database settings go in .observable/databases.json. For example:
{ "mydb": { "type": "postgres", "host": "localhost", "database": "analytics", "username": "analyst" }}MAKE SURE to add .observable/ to your .gitignore to avoid committing credentials.
I’ve updated [my kicking the tyres post notebook])(https://codeberg.org/hrbrmstr/tyres/src/branch/batman/docs/index.html) to show how to work with DuckDB, and also updated my handy standalone notebooks creator NPM script to make it straightforward to kickstart a new DB-powered local notebook.
I’m really looking forwared to the incremental improvements the Observable team are clearly planning to release, and am excited to figure out more ways to use and embed v2.0 notebooks into EDA and other workflows.
Textplot
Full Disclosure: I have not tried this extension out, yet, but it looks super cool!
The Textplot DuckDB Extension makes it possible to add pretty fun (and, useful) ASCII/Unicode data visualizations directly into your SQL queries.
Instead of exporting data to create charts elsewhere, you can now generate visual representations right in your DuckDB console session. This is super handy for quick data exploration, monitoring, and even creating lightweight dashboards without heavy charting libraries.
The site has scads of detailed examples with code and output, so there’s no need for me to add any here (especially since I haven’t tried working with it yet).
If you do get to play with it, drop me a note to let me know your experience with it.
FIN
Remember, you can follow and interact with the full text of The Daily Drop’s free posts on:
- 🐘 Mastodon via
@dailydrop.hrbrmstr.dev@dailydrop.hrbrmstr.dev - 🦋 Bluesky via
https://bsky.app/profile/dailydrop.hrbrmstr.dev.web.brid.gy
☮️
#duckdb